The Lake Did Not Get 656 Times Dirtier. The Test Finally Looked Smaller.

Last reviewed: by the MicroPlastics Research Desk. Submit a correction or see our editorial standards.
Quick Answer
Holding a different bottle? Review its confirmed or estimated material and Product Contact Signal, then compare a lower-contact option.
Scan my product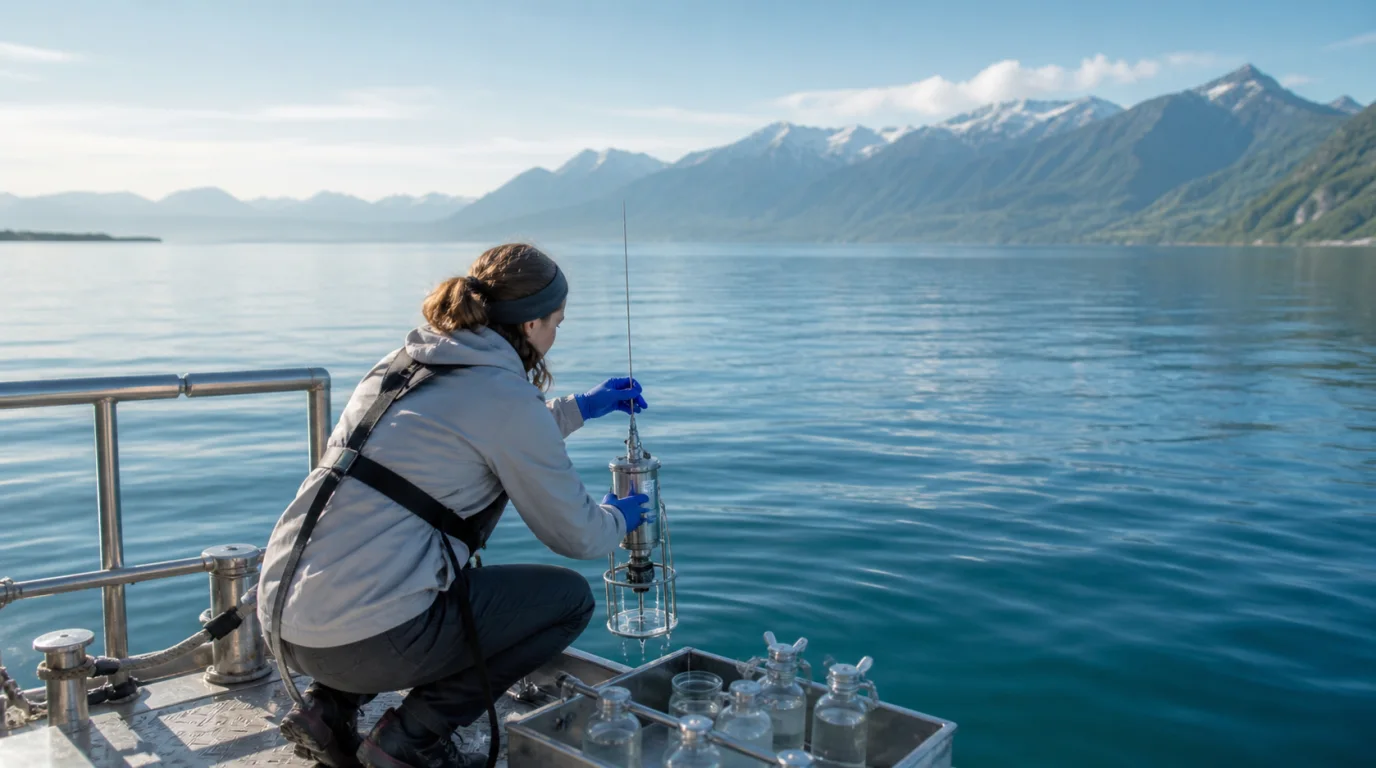
Key Takeaways
- Size threshold controls the count. A 300 µm net and a 5 µm instrument are not measuring the same population.
- Small particles dominated. The paper estimated up to 97% of particles fell between 1 and 20 µm.
- Measured concentrations were 33–687 particles/L in surface waters for the directly measured 5–70 µm range.
- The 226–656× comparison is methodological. It compares a 1–100 µm projection with older manta-trawl surveys that used much larger mesh.
- The method was checked against LDIR. Counts were generally within the same order of magnitude when size ranges were aligned.
- It is not a drinking-water exposure study. Samples came from Lake Geneva, its depth profile and surrounding rivers—not treated household taps.
- The projection has uncertainty. The instrument identifies from 5 µm; values down to 1 µm were estimated from the observed size relationship.
The scale of the method change
- particle range directly classified by the new method
- 5–70 µm
- with a statistical projection extending the distribution to 1 µm
- Hassler et al., 2026
- maximum estimated share in the 1–20 µm band
- 97%
- the fraction most likely to disappear from surveys built around much larger mesh
- Hassler et al., 2026
- directly measured concentration across surface waters
- 33–687/L
- for particles in the 5–70 µm range at the study confidence threshold
- Hassler et al., 2026
- increase over older manta-trawl reports
- 226–656×
- after projecting the population to 1–100 µm; not a change in the lake over time
- Hassler et al., 2026
- average recovery after sample preparation
- 87%
- across the polymers included in the validation protocol
- Hassler et al., 2026
A net does not measure what passes through it
Many early freshwater surveys pulled a manta net through the surface. The method is useful for larger fragments, but a mesh of 100–300 µm physically cannot retain most particles smaller than its openings. The reported concentration is therefore not “all microplastics.” It is all particles large enough for that sampling and analytical chain to retain and identify.
This is why two credible studies can report numbers separated by orders of magnitude without either being fraudulent. They may be counting different size universes. Our earlier international drinking-water report makes the same caution about comparing countries that use different thresholds.
How the new method works
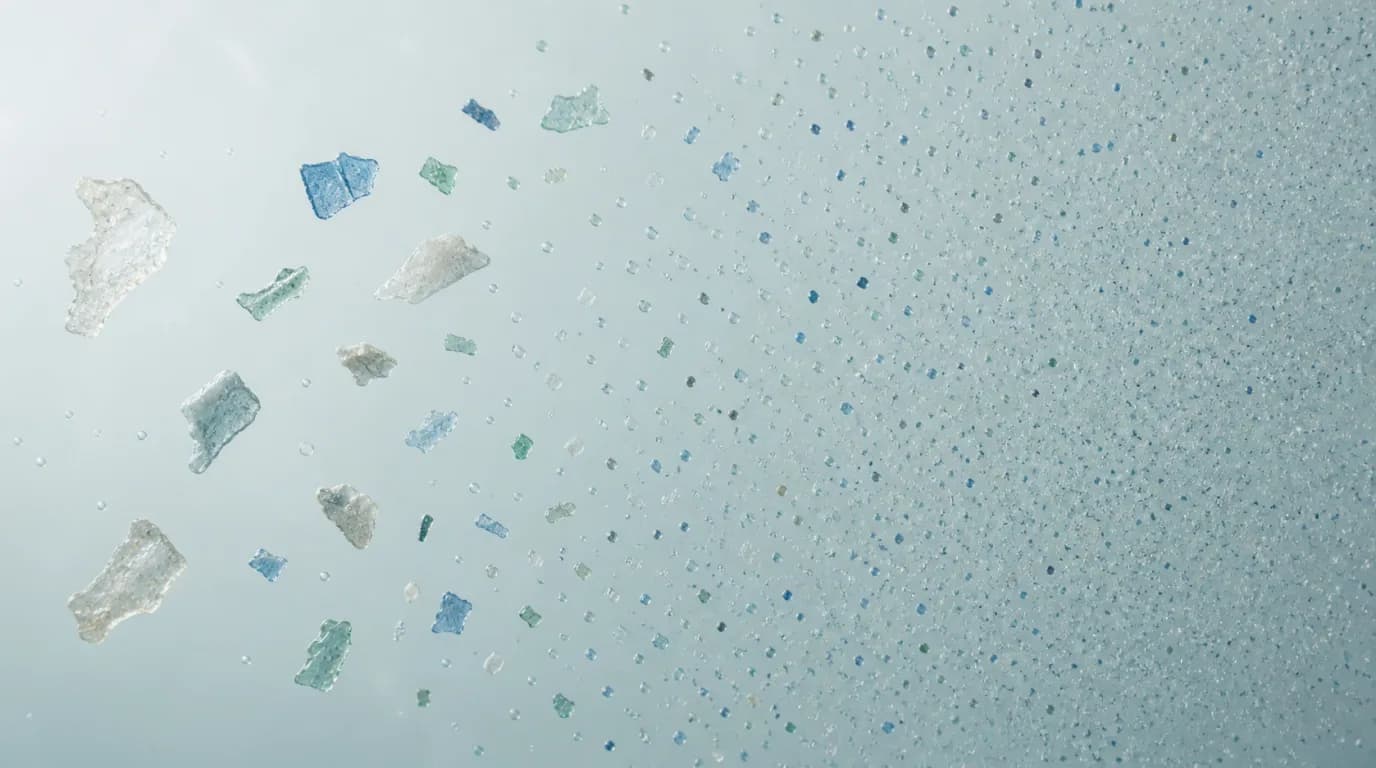
Hassler and colleagues combined sample digestion and density separation with spectral flow cytometry. Particles pass through an optical measurement zone one by one. Sixty-four detectors spanning 373–812 nm capture a spectral signature, and two machine-learning models decide first whether a particle is plastic and then which trained polymer family it resembles.
The models were trained on 235,955 plastic particles and 258,663 non-plastic particles. They classified PET, polycarbonate, polyurethane and PVC, while polyethylene and polypropylene were grouped because their signatures were not reliably separable. Direct recovery exceeded 95% in most tested natural waters; the full preparation protocol averaged 87% recovery.
The team cross-checked natural and synthetic samples with laser direct infrared spectroscopy. When they aligned the size ranges, the techniques generally landed in the same order of magnitude—important reassurance that the higher counts came from seeing smaller material rather than from an unconstrained algorithm.
What Lake Geneva looked like at smaller scale
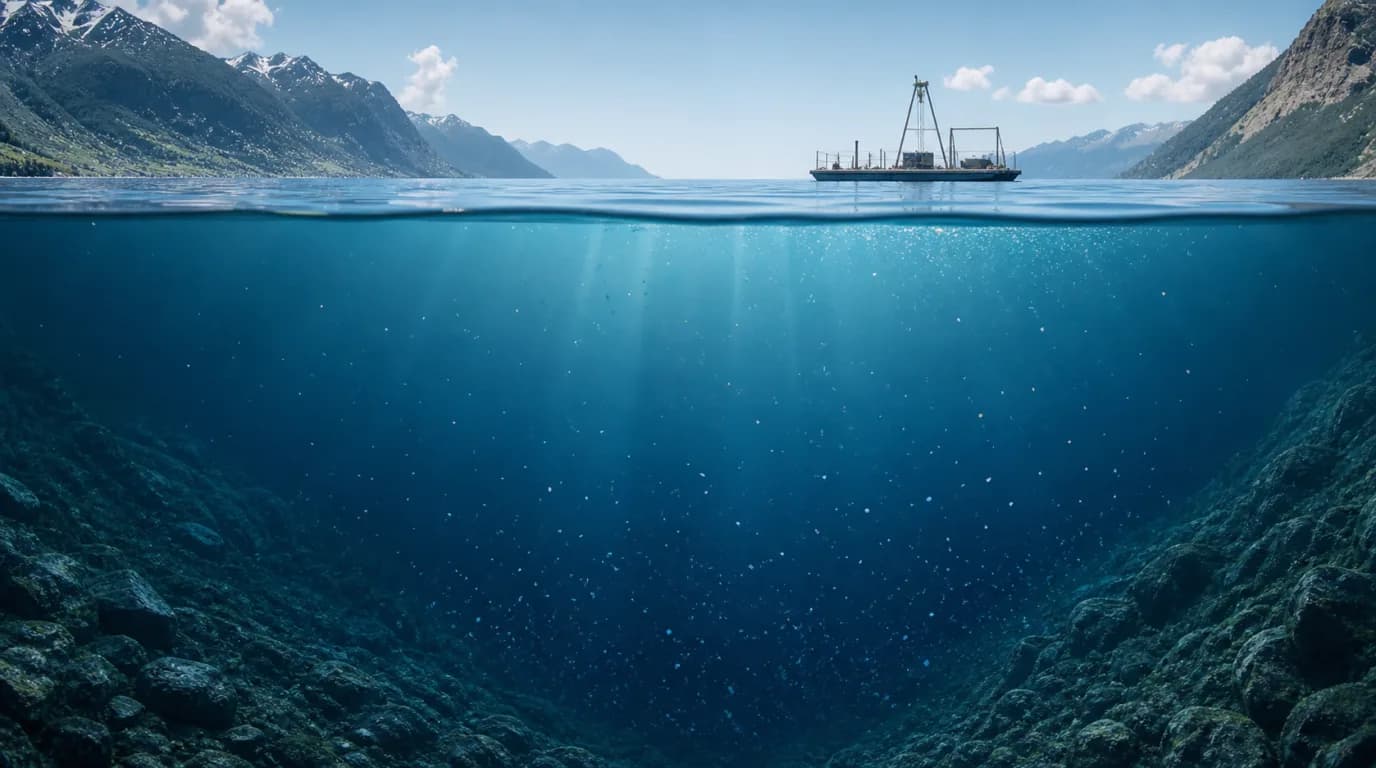
Direct measurements in the 5–70 µm band ranged from 32.9 to 687.1 particles per litre in surface waters and from 6.9 to 154.6 per litre through the water column. A seven-sample reproducibility exercise at the lake platform averaged about 121 particles per litre.
The smallest directly measured band dominated: particles from 5–15 µm represented 63.9% at the lake surface, 71.2% in rivers and 90% offshore and at depth. Extending the observed relationship down to 1 µm produced projected averages of 338.6 particles/L for inshore surface water, 680.7/L for deep lake water and 983.4/L for rivers—with wide ranges around each estimate.
Why the headline is 656×—and how not to misuse it
The study’s projection to 1–100 µm exceeded historical manta-trawl lake reports by 226–656 times. That comparison does not mean Lake Geneva became 656 times dirtier. It means the projected size window contains far more particles than the older net retained.
Nor should the upper multiplier be pasted onto every water result. Particle-size distributions differ between rivers, lakes, bottles and treated tap water. The correct takeaway is methodological: always report the lower size cutoff beside a particle count.
What the method still cannot tell us
- It does not directly see below 5 µm. The 1–5 µm portion is a projection, not a counted population.
- It does not yet classify every important polymer. Polystyrene, polyamide, PTFE and rubber were outside the trained set.
- PE and PP remain grouped. The method detects that class but cannot reliably split the two.
- Weathered particles are harder than clean standards. The authors call for more training on naturally altered polymers.
- Environmental risk thresholds remain uncertain. Species-sensitivity comparisons combine different polymers, sizes and organisms.
What this means for readers
It does not change the practical hierarchy in our tap-versus-bottled-water guide. This was natural-water monitoring, not a trial of household treatment. What it changes is how you read a number. “121 particles per litre” is incomplete without “measured from 5–70 µm.” A lower count from a 300 µm net is not automatically cleaner water.
Better instruments often make pollution appear to jump because the invisible part of the distribution becomes countable. That is progress in measurement, not proof of a sudden environmental event.
Frequently Asked Questions
Did Lake Geneva microplastics increase 656 times?
How many microplastics were found in Lake Geneva?
Why are smaller microplastics more numerous?
Did the study measure nanoplastics?
Was this drinking water?
Is machine learning guessing which particles are plastic?
Sources
- Hassler CS, Peixoto R, Breider F, Tunali M, et al. (2026). Revisiting microplastic pollution: A novel method for detecting small-sized microplastics in natural waters. npj Clean Water 9, Article 62.
- Thompson RC, et al. (2024). Twenty years of microplastic pollution research—what have we learned?. Science 386:eadl2746.
Track every water source you actually drink
Save bottled brands, filtered tap sources, and travel-water situations to compare a modeled packaging-contact pattern over time. It is not a personal exposure profile.
Download on the App Store- Free on iOS
- 3 free scans
- No sign-up
- Result in seconds
“Really cool to scan stuff around the kitchen and see what's actually in it. The swaps it suggests are realistic.” App Store review · 5.0★
Android · early access
Get the launch email the day Android opens.
One email. No spam. We send when the Android app is in the Play Store, and never again unless you opt in.
Related Research
The EPA Just Listed Microplastics — and Declined to Measure Them
On 6 April 2026 the EPA put microplastics on its draft Contaminant Candidate List for the first time in the list’s 30-year history. Three months later it left them out of UCMR 6, the rule that would actually require water systems to test for them. Both are true, and almost nobody reported them together.
Read moreIs Owala Non-Toxic? The Body Is Fine — the Answer Is in the Lid
The insulated body is stainless steel and inert, and the BPA-free claim is genuine rather than a BPS substitution. The microplastics question lives entirely in the lid: a Tritan spout and a polypropylene flip mechanism, where cap abrasion measures 131 particles per litre after a single opening.
Read moreMicroplastics in Ice: Does Your Ice Maker or Tray Add Plastic? (2026)
Ice is only as clean as the water you froze it from, freezing removes nothing. Plastic trays, ice-maker bins, and cheap bagged ice can add more. What the science says and how to make the lowest-microplastic ice at home.
Read moreBest Electrolyte Powders Without Microplastics: Liquid IV, LMNT & More Ranked (2026)
No brand tests its powder for microplastics, so your exposure is the sachet, the water you mix into, and the shaker. The honest ranking of Liquid IV, LMNT, Nuun, and Ultima, plus how to cut plastic from every serving.
Read moreDoes Liquid Death Have Microplastics? Why the Aluminum Can Actually Matters (2026)
Probably less than bottled water in plastic, and the packaging is why. Liquid Death is mountain water in an aluminum can, which sidesteps the PET-shedding problem, though the thin can liner adds nuance. What the research supports.
Read moreDoes Smartwater Have Microplastics? Vapor-Distilled, Still Bottled in PET (2026)
Very likely. Smartwater is vapor-distilled tap water in a PET bottle. Distillation genuinely purifies the source water and skips the RO membrane PNAS flagged, but the bottle and cap still shed. What the research supports, and the lower-plastic-contact comparison.
Read more