International Report: Microplastics in Drinking Water (2026)
Last reviewed: by the MicroPlastics Research Desk. Submit a correction or see our editorial standards.
Quick Answer
Holding a different bottle? Review its confirmed or estimated material and Product Contact Signal, then compare a lower-contact option.
Scan my product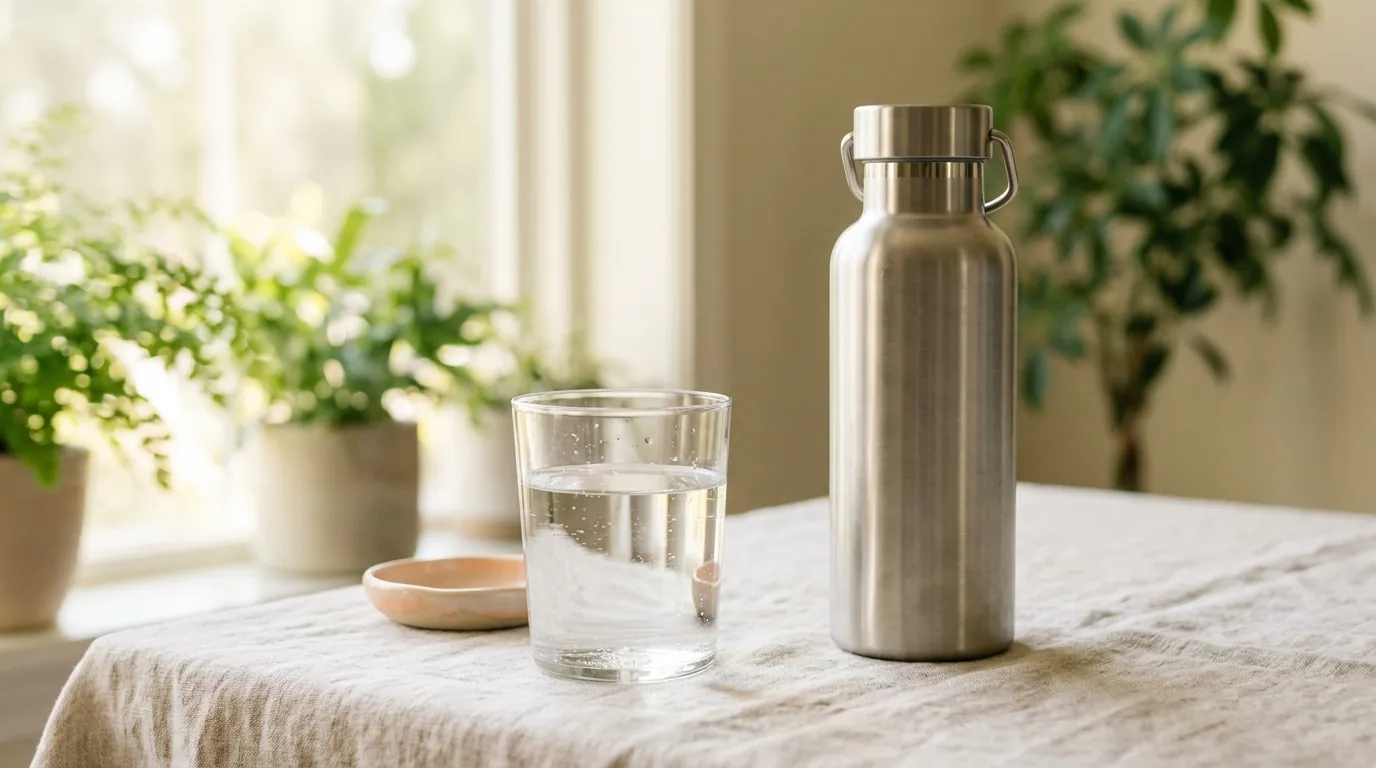
Key Takeaways
- WHO's 2019 review found microplastics in drinking water but did not set a regulatory limit. Updates through 2024 maintain this position pending more data.
- A January 2024 Columbia University study published in PNAS detected ~240,000 nanoplastic particles per liter of bottled water. 10–100× higher than prior estimates.
- The US EPA added six PFAS to enforceable drinking-water limits in 2024 but has not yet set a microplastics standard.
- Tap water consistently contains fewer microplastics than bottled water across every country measured.
- Regions with the highest contamination per sample include parts of South Asia, Sub-Saharan Africa, and dense industrial corridors. Scandinavia and Switzerland consistently test cleanest.
What “the international report” actually refers to
There is no single “international report on microplastics in drinking water”, instead there is a body of work from major intergovernmental and academic institutions that together form the global evidence base. Most news coverage in 2024 and 2025 referenced one of four documents:
- WHO, “Microplastics in drinking-water” (2019), the first comprehensive international assessment, updated technically through 2024.
- Qian, Tao, et al., PNAS (January 2024), the Columbia/Rutgers team that used stimulated Raman scattering microscopy to detect nanoplastics in bottled water at scales 10–100× higher than older methods could measure.
- UN Environment Programme “Plastic Pollution” report series, tracks plastic flows into freshwater systems globally.
- European Food Safety Authority (EFSA) opinions, feeds into the EU's microplastics restriction that began taking effect in 2025.
Headline finding: 80%+ of drinking water samples worldwide contain microplastics
The 2018 Orb Media / SUNY Fredonia investigation tested 259 bottled-water samples from 11 brands across 9 countries and found microplastic contamination in 93% of them, with an average of 325 particles per liter. Independent tap-water sampling across 14 countries found microplastics in 83% of samples, averaging roughly 5.45 particles per liter. Subsequent peer-reviewed analyses through 2024 have replicated these ranges, meaning contamination is the rule, not the exception.
The 2024 PNAS study fundamentally shifted what we mean by “detected”: using stimulated Raman scattering microscopy, the Columbia/Rutgers team identified individual nanoplastic particles down to ~100 nanometres, most of which are invisible to the techniques used in earlier surveys. Their bottled-water samples averaged ~240,000 plastic particles per litre, approximately 90% of which were nanoplastics smaller than 1 µm.
Regions with the highest contamination levels
Contamination varies dramatically by country. The figures below combine peer-reviewed sampling studies, government monitoring data, and WHO regional reports. They reflect typical municipal tap water; bottled water in every region tested higher.
| Region / Country | Average particles/L | Notes |
|---|---|---|
| Switzerland | ~0.7 | Cleanest in published studies; advanced filtration |
| Scandinavia (DK, NO, SE, FI) | ~1–3 | Strong source protection; cold climate |
| Germany / Netherlands | ~2–5 | Modern multi-barrier treatment |
| United States | ~4–9 | 94% of samples positive (2017 Orb Media) |
| United Kingdom | ~3–7 | Older distribution networks vary |
| Italy / Spain | ~5–9 | Higher in coastal regions |
| India (major cities) | ~10–25 | Heavy plastic waste loading; old pipes |
| Indonesia / Philippines | ~10–30 | High riverine plastic flux |
| Sub-Saharan urban Africa | ~10–40 | Limited treatment infrastructure |
| Lebanon (Beirut) | ~5–25 | Reported among the highest peaks worldwide |
Ranges are typical reported values; individual studies use different size thresholds (often >10 µm), so direct comparisons should be treated as order-of-magnitude rather than precise. See our country-by-country deep-dive for full sourcing.
What the reports actually conclude about your health
The WHO's position (repeated in each technical update) is that current evidence does not indicate microplastics in drinking water pose a confirmed risk at typical concentrations. That conclusion sits alongside a clear acknowledgement of three gaps:
- Nanoplastics are essentially unmeasured in regulatory monitoring. The 2024 PNAS study suggests prior estimates undercounted by one to two orders of magnitude.
- Chronic, lifelong exposure has not been studied. All current risk statements are based on short-term toxicology.
- Vulnerable populations, pregnant women, infants, and people with chronic illness, are not separately characterised.
Several 2024–2025 peer-reviewed papers have begun filling these gaps. The New England Journal of Medicine 2024 study found microplastics in artery plaque correlated with a 4.53× increase in major cardiovascular events over a 34-month follow-up, the first prospective human evidence of harm. For our full coverage, see microplastics and cancer and microplastics health effects.
Bottled water versus tap water: what every report agrees on
Across every dataset published since 2018, bottled water has contained more microplastics than tap water from the same region, typically 2× to 22× more depending on the comparison and detection method. The dominant explanation is contact with PET, polypropylene caps, and processing equipment, accelerated by heat and UV during transport and storage.
For a full breakdown of why bottles leach, see microplastics in bottled water and microplastics in tap water.
What changed between 2024 and 2026
- Nanoplastic detection went mainstream. SRS microscopy and Raman tweezers now allow routine quantification below 1 µm, exposing previously invisible exposure.
- The EU microplastics restriction entered force (2023, in stages).Member states must phase out intentionally added microplastics in cosmetics, detergents, and other products through 2035. See our EU microplastics ban explainer.
- California became the first US state to require microplastics monitoring in drinking water (SB 1422, four-year monitoring program beginning 2023, results being released 2025–2026).
- WHO began updating its 2019 review with a planned second edition incorporating nanoplastic evidence; the draft entered consultation in late 2025.
- The NEJM cardiovascular study (2024) shifted the conversation from “hypothetical risk” to “measurable association” in human patients.
What you can actually do today
While regulators continue to define risk, individual exposure can be meaningfully reduced with three changes the international literature consistently supports:
- Use a reverse-osmosis or high-quality activated-carbon-block filter on your tap. RO removes 99%+ of microplastics including nanoplastics; carbon block removes most particles >2 µm.
- Carry a glass or stainless-steel bottle. Eliminates the single largest exposure source identified across every report.
- Avoid heating water or food in plastic. Thermal stress is the largest amplifier of leaching in every laboratory model.
For step-by-step practical changes, see how to avoid microplastics, or the regulatory picture in the EU microplastics ban.
What the MicroPlastics app checks
- Bottled drink material. PET, HDPE, glass, aluminum.
- Container condition signals from the photo.
- Brand and SKU variant.
- Use-context flags you log, heat, reuse, storage time.
- Linked published research behind the 0–100 risk score.
Use the App
Scan bottled drinks and water products before you buy
Tap the barcode and snap a photo. The MicroPlastics app weighs packaging material + brand + condition and gives a 0–100 risk score with a safer swap.
Scan water products in the appFrequently Asked Questions
Is there a single 2026 international report on microplastics in drinking water?
Which countries have the cleanest drinking water for microplastics?
Which regions have the highest microplastic contamination?
Does WHO consider microplastics in drinking water dangerous?
Does boiling water remove microplastics?
What removes microplastics from water most effectively?
Is bottled water worse than tap water for microplastics?
Sources
- World Health Organization (2019). Microplastics in drinking-water. WHO.
- Qian N, Gao X, Lang X, et al. (2024). Rapid single-particle chemical imaging of nanoplastics by SRS microscopy. PNAS.
- Mason SA, Welch VG, Neratko J. (2018). Synthetic polymer contamination in bottled water. Frontiers in Chemistry.
- Marfella R, Prattichizzo F, Sardu C, et al. (2024). Microplastics and nanoplastics in atheromas and cardiovascular events. New England Journal of Medicine.
- Yu Z, Wang J, Liu L, et al. (2024). Drinking boiled tap water reduces human intake of nanoplastics and microplastics. Environmental Science & Technology Letters.
- European Chemicals Agency (ECHA) (2023). Restriction on intentionally added microplastics. ECHA.
- California State Water Resources Control Board (2022). Microplastics Policy Handbook (SB 1422 implementation). CA SWRCB.
Track every water source you actually drink
Save bottled brands, filtered tap sources, and travel-water situations to compare a modeled packaging-contact pattern over time. It is not a personal exposure profile.
Download on the App Store- Free on iOS
- 3 free scans
- No sign-up
- Result in seconds
“Really cool to scan stuff around the kitchen and see what's actually in it. The swaps it suggests are realistic.” App Store review · 5.0★
Android · early access
Get the launch email the day Android opens.
One email. No spam. We send when the Android app is in the Play Store, and never again unless you opt in.
Related Research
Which Country Has the Most Microplastics in Tap Water? (2026 Global Ranking)
Tap-water microplastic levels range from <1 to 1,500+ particles per litre worldwide. The 2026 country-by-country ranking with WHO baseline, regional studies, and what drives the gap between the lowest-contact and dirtiest taps.
Read moreBottled Water Microplastics: What to Drink Instead
A 2024 PNAS study counted ~240,000 plastic particles per liter in bottled water: 90% nanoplastics. Why bottles shed, what raises risk, and what to drink instead.
Read moreMicroplastics in Tap Water: Is Your Drinking Water Safe?
94% of US tap water samples contain microplastics. What actually removes them, why the boiling trick only works in hard water, and which filter certification to look for.
Read moreTap Water vs Bottled Water: Which Has More Microplastics?
Bottled water averages ~240,000 particles/L; unfiltered tap is far lower; filtered tap is the lowest-contact everyday option. Full comparison plus filter picks.
Read moreMicroplastics in Sparkling Water: LaCroix, Bubly & Spindrift Ranked (2026)
Cans beat plastic bottles, and carbonation is why the gap is wider than for still water. CO2 pressure and agitation raise shedding from PET. LaCroix, Bubly, Spindrift, Waterloo, Topo Chico and Perrier ranked, plus the can-liner trade-off.
Read moreDo Alkaline Waters Have Microplastics? Essentia, Core & Flow Ranked (2026)
Yes, and raising the pH does nothing about it. Nearly every alkaline water ships in the same PET as ordinary bottled water, at two to four times the price. Essentia, Core, Flow, Alkaline88 and BodyArmor compared, plus the one carton worth buying.
Read more