Bottled Water Microplastics: Which Bottles Are Riskiest and What to Drink Instead
Last reviewed: by the MicroPlastics Research Desk. Submit a correction or see our editorial standards.
Quick Answer
Holding a different bottle? Review its confirmed or estimated material and Product Contact Signal, then compare a lower-contact option.
Scan my product
Bottled water feels clean, but the packaging tells a different story. A single liter of bottled water can contain hundreds of thousands of tiny plastic particles, most small enough to be classified as nanoplastics. The risk is not the same for every bottle. Plastic type, heat history, reuse, dents, storage time, and acidity all change the score.
Bottled water, the numbers
- plastic particles per liter (average)
- 240,000
- across 25 mainstream bottled water brands
- PNAS 2024 (Qian et al.)
- identified in the same PET bottles
- 7 polymers
- PET, PE, PVC, polyamide, polystyrene, polypropylene, polymethyl methacrylate
- PNAS 2024
- higher cardiovascular event risk
- 4.53×
- in patients with microplastics in arterial plaque
- NEJM 2024 (Marfella et al.)
- certified microplastic reduction
- 96–99.8%
- filters certified to NSF/ANSI 401, e.g. PUR PLUS, Brita Elite, AquaTru (particles 0.5–1 µm)
- NSF water filter FAQs
| Risk driver | Why it matters | Lower-risk move |
|---|---|---|
| PET single-use bottles | Shed nanoplastics with shelf time, heat, UV | Glass or stainless reusable + filtered tap |
| Caps & screw threads | HDPE friction releases fragments at every open | Pour, do not lip-sip; or use glass with metal cap |
| Hot car / warm storage | Heat accelerates polymer breakdown | Never store cases in car / garage / shed |
| Reused single-use bottles | Surface scratches multiply particle release | Reuse stainless or borosilicate only |
| Long shelf time | Months on shelf = more migration | Buy what you drink in a week, not a quarter |
| Sparkling / acidic flavored water | Lower pH speeds plasticiser leaching | Carbonate at home in glass; or aluminum cans |
Key Takeaways
- A 2024 PNAS study counted ~240,000 plastic particles per liter in bottled water, ~90% nanoplastics.
- Older counts (e.g., ~325 particles/L in earlier work) missed nanoplastics entirely, they were below detection.
- PET bottles shed more after heat, sunlight, dents, scratches, and long storage.
- The cap and screw thread are an under-discussed but consistent fragment source.
- Filtered tap in glass or stainless beats most bottled water on cumulative microplastic load.
- Scan brand + packaging condition before stocking up, the score can differ across a single brand's SKUs.
How bottled water gets contaminated
The plastic in your bottled water didn't come from a polluted spring. It came from the bottle, the cap, and the journey from bottling line to your hand. Five real mechanisms:
- PET hydrolysis. Polyethylene terephthalate breaks down over time, faster with heat, UV, and humidity. Each cycle releases more particles into the water.
- Mechanical friction at the cap. The HDPE cap and bottle threads scrape micro-fragments every time the bottle is opened or torqued during shipping.
- Heat during transport and storage. Trucks, warehouses, and the garage you stored the case in all push polymer breakdown.
- Acidity from carbonation or flavor. Sparkling and flavored waters sit at lower pH, which speeds plasticiser migration.
- Dents, scratches, and reuse. Surface damage exposes fresh polymer to the water. Single-use bottles are not designed for reuse.
What the 2024 PNAS study actually found
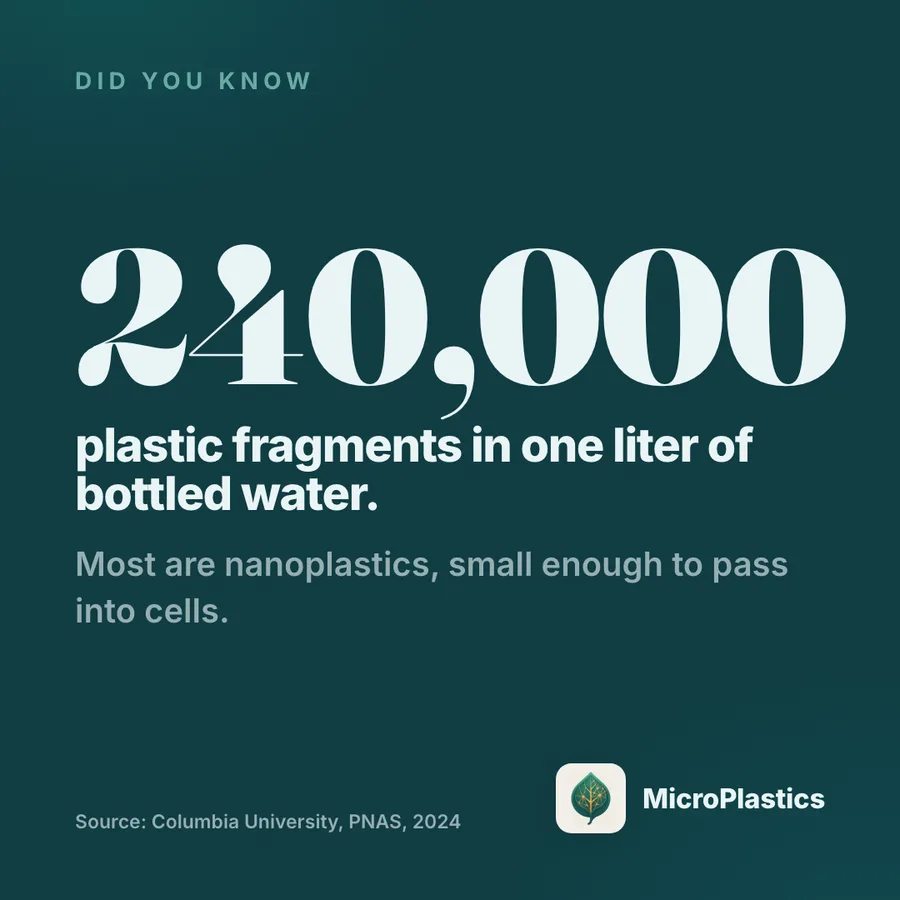
The study (Qian et al., PNAS, January 2024) used a new laser imaging method (stimulated Raman scattering) that finally let researchers count nanoplastics, particles smaller than 1 micrometer that earlier methods missed. Across three popular US bottled water brands they found 110,000 to 370,000 plastic particles per liter, averaging ~240,000. About 90% were nanoplastics.
The number that went viral wasn't hype. It was a measurement problem being solved. Prior bottled water studies had counted only microplastics >1 µm and missed the rest of the population entirely.
PET, caps, and what actually sheds the most
| Part | Plastic | Shedding profile |
|---|---|---|
| Bottle body | PET (#1) | Slow steady release; faster with heat / UV / time |
| Cap | HDPE (#2) (often PP liner | Friction at threads) high per-open release |
| Label | OPP / PE film | Surface contact; lower water-side release |
| Carbonation seal | Various polymer blends | Higher migration at low pH |
Bottled vs tap vs filtered tap
| Source | Typical microplastic load | Verdict |
|---|---|---|
| Single-use PET bottled water | ~240,000 particles/L (incl. nanoplastics) | Highest daily exposure for most people |
| Glass-bottled spring water | Far lower; mainly cap-side release | Better than PET; expensive |
| Unfiltered municipal tap | Variable, averages a few to a few hundred particles/L in studies | Cheaper than bottled; quality varies |
| Activated-carbon-block filtered tap | Reduced by 80-99% in pitcher / under-sink studies | Best cost-to-performance ratio |
| Reverse osmosis filtered tap | Near-elimination of microplastics + most PFAS | Lowest measured microplastic load |
See the brand-by-brand ranking in our bottled water brands ranked guide, and the filter-by-filter comparison in our water filters compared guide.
What to do today
- Stop buying cases of single-use PET and storing them in the car, garage, or hot pantry.
- Filter your tap water with a filter certified to NSF/ANSI 401 for microplastics, such as the PUR PLUS or Brita Elite pitcher.
- Refill into glass or stainless for the road. Skip BPA-free plastic refills, they shed too.
- If you must buy bottled, pick glass-bottled or aluminum-canned spring water and avoid hot storage.
- Skip sparkling water in plastic. Low pH + plastic = faster leaching. Carbonate at home in glass.
- Scan the brand before you buy. Within a single brand, sizes and packaging variants can score differently.
What the MicroPlastics app checks
- Packaging material. PET, HDPE, glass, aluminum, multi-layer.
- Container condition signals, dents, scratches, label wear from the photo.
- Brand history and product category, bottled water vs sparkling vs flavored.
- Storage and reuse context you log, heat, sun, age, refill cycles.
- Cited research underlying the 0–100 risk score, with the source studies linked inside the scan.
Use the App
Scan bottled drinks before you buy the case
Tap the barcode and the photo. The app weighs material, condition, brand, and the cited studies, then gives a 0–100 risk score and a safer swap if the score is high.
Scan bottled water in the appRelated reading: bottled water brands ranked, water filters compared, best stainless steel water bottles, and microplastics in drinking water by country.
Frequently Asked Questions
Is bottled water high in microplastics?
Which bottled water has the least microplastics?
Is tap water better than bottled water?
Does freezing or heating a plastic water bottle release more microplastics?
Are BPA-free bottles safer?
Do home water filters remove microplastics?
Should I throw away the bottled water I already bought?
Sources
- Qian N, Gao X, Lang X, et al. (2024). Rapid single-particle chemical imaging of nanoplastics by SRS microscopy. PNAS.
- Mason SA, Welch VG, Neratko J (2018). Synthetic Polymer Contamination in Bottled Water. Frontiers in Chemistry.
- WHO (2022). Dietary and inhalation exposure to nano- and microplastic particles and potential implications for human health. World Health Organization.
- Eerkes-Medrano D, Leslie HA, Quinn B (2019). Microplastics in drinking water: a review and assessment. Current Opinion in Environmental Science & Health.
- NSF International (2024). Water filters and treatment: certification standards (NSF/ANSI 401 covers microplastics). NSF.
Track every water source you actually drink
Save bottled brands, filtered tap sources, and travel-water situations to compare a modeled packaging-contact pattern over time. It is not a personal exposure profile.
Download on the App Store- Free on iOS
- 3 free scans
- No sign-up
- Result in seconds
“Really cool to scan stuff around the kitchen and see what's actually in it. The swaps it suggests are realistic.” App Store review · 5.0★
Android · early access
Get the launch email the day Android opens.
One email. No spam. We send when the Android app is in the Play Store, and never again unless you opt in.
Related Research
Microplastics in Tap Water: Is Your Drinking Water Safe?
94% of US tap water samples contain microplastics. What actually removes them, why the boiling trick only works in hard water, and which filter certification to look for.
Read moreTap Water vs Bottled Water: Which Has More Microplastics?
Bottled water averages ~240,000 particles/L; unfiltered tap is far lower; filtered tap is the lowest-contact everyday option. Full comparison plus filter picks.
Read moreMicroplastics in Sparkling Water: LaCroix, Bubly & Spindrift Ranked (2026)
Cans beat plastic bottles, and carbonation is why the gap is wider than for still water. CO2 pressure and agitation raise shedding from PET. LaCroix, Bubly, Spindrift, Waterloo, Topo Chico and Perrier ranked, plus the can-liner trade-off.
Read moreDo Alkaline Waters Have Microplastics? Essentia, Core & Flow Ranked (2026)
Yes, and raising the pH does nothing about it. Nearly every alkaline water ships in the same PET as ordinary bottled water, at two to four times the price. Essentia, Core, Flow, Alkaline88 and BodyArmor compared, plus the one carton worth buying.
Read moreDoes Boiling Water Remove Microplastics? Up to 90%, If Your Water Is Hard
Yes, and it is the cheapest method that works. Boiling hard tap water makes calcium carbonate crystallise around nano- and microplastics, trapping them in scale you can filter out: up to ~90% removal in very hard water, only ~25% in soft. The two steps most people miss.
Read moreHard Water vs Soft Water for Microplastics: Why Hardness Changes Everything
Water hardness decides whether boiling removes microplastics or does almost nothing. Calcium and magnesium form the scale that traps particles, so hard water gets up to ~90% removal and soft water closer to 25%. How to find your hardness and what to do at either end.
Read more